

Trade liberalisation is considered part of the overall strategy for creating wealth through trade creation.
The simple definition of trade liberalisation is the removal or reduction of restrictions or barriers on the free exchange of goods between nations. These barriers include tariffs, such as duties and surcharges, and nontariff barriers, such as licensing rules and quotas.
One modality for trade liberalisation is regional and bilateral trade agreements. Sri Lanka has entered into bilateral free trade agreements (FTA) with India, Pakistan, Singapore, and Thailand.
Apart from bilateral free trade agreements Sri Lanka has been a signatory to APTA (Trade block of Bangladesh, China, Korea, India, Laos, Mongolia, and Sri Lanka) SAPTA, and SAFTA (Trade block of Afghanistan, Bangladesh, Bhutan, India, Maldives, Nepal, Pakistan, and Sri Lanka).
At a time when Sri Lanka is trying to join the Regional Comprehensive Economic Partnership-(RCEP) the world’s largest trade block– it may be useful to analyse the trade performance of Sri Lanka with those FTA partners.
Imports
Around 90 percent of imports from partner countries such as India, China, and Pakistan take place outside the trade agreements and goods are subject to payment of tax in full without any concessions (Table 1, 2, 3).
An analysis of Sri Lanka’s top 20 imports from India such as petroleum products, iron and steel, fabrics, cotton, pharmaceutical products, cane sugar, paper, wheat, plastics, pepper, cement, tractors, boilers, machinery, and mechanical appliances, vegetables, spices, rice, staple fib, apparel, and carbon continue to maintain its demand in Sri Lanka.
The reasons are partly due to a lack of domestic production or short supply. Similarly, products of Chinese origin continue to maintain their demand in the Sri Lankan market.
Then the question arises as to why Sri Lankan buyers can’t purchase these country requirements from other countries.
Simply, it’s because both India and China are low-cost manufacturing destinations in Asia offering competitive pricing and enjoying the comparative advantage as well. The economies of scale, high productivity, low raw material cost, and government subsidies allow both countries to offer better value for money than competitors even after paying taxes in full.
Therefore the influx of imports is clearly due to those reasons and not due to the effects of trade agreements.
Exports
Currently, only nine percent of Sri Lanka’s total exports (Table 4) excluding GSP and, GSTP happen under trade agreements.
Sri Lanka has a limited export basket and the best export prospects such as apparel, tea, rubber, coconut and spices in the basket have been effectively blocked by either refusing to grant any tax concessions or imposing quotas/licences.
Undoubtedly, this protectionist policy by our partner countries has a big negative impact on Sri Lanka’s export growth. When border taxes are coupled with Sri Lanka’s high production cost, marketing our best export prospects in our partner countries becomes a nightmare.
The issue does not end up there. Sri Lankan exports are also facing non-tariff measures and stringent regulations in partner countries.
Finally, all these factors critically affect the entry of Sri Lanka’s exports into other countries.
Trade coverage under FTAs
A decade has passed after signing bilateral trade agreements with India and Pakistan but still Sri Lanka’s utilisation of tariff lines under those trade agreements is less than 10 percent (both countries offered over 4,000 tariff lines each).
In the late 90s and early 2000s, the pro-trade liberalisation camp in Sri Lanka had touted these agreements as a step taken in the right direction to conquer the world’s biggest markets.
Statistically, it’s evident that Sri Lanka’s free trade agreements failed to create trade and a major portion of trade occurred outside FTAs.
The pro-trade liberalisation camp should understand the critical success factors behind international trade. Is it the demolition of tariffs or other factors such as productivity, competitiveness, or comparative advantage of goods and services?
In this case, two Asian giants, China and India, are a good case study to understand the critical success factors for international trade.
Trade between China and India
As of 2023, India’s bilateral trade with China reached $ 118.4 billion and imports from China increased to $ 101.7 billion while exports from India to China have reached $ 16.67 billion annually.
China mainly exports manufactured goods to India, and India exports to China mainly primary products and semi-finished products.
Under the Asia Pacific Trade Agreement (APTA), India has granted general concessions for 3,142 tariff lines to member countries, which can be used by China, and in turn, China has granted general concessions for 2,191 tariff lines under the same category, which India can use.
India’s trade deficit with China stands at $ 85 billion as of 2023 – India’s highest trade deficit with a single country.
This phenomenon can only be understood by understanding China’s high trade complimentary, massive production capacity, productivity, and comparative advantage as opposed to India.
In fact, China is much ahead in the global value chain, and their labour productivity, use of new technology, skills of employees, scale of enterprises, and government subsidies are higher than that of India.
China’s average total productivity factor (TFP) is 11 percent higher than that of India. In fact, as of 2022, the average applied import duty by India on Chinese goods is approximately 18.3 percent.
Despite this high import duty, Chinese raw materials and finished products continued to maintain a high demand in India. The ability of Chinese products to offer value for money to Indian customers better than its competitors is the real factor behind China’s export growth with India.
Trade between India and South Asia
India’s total imports from South Asian countries are less than one percent of its total imports from the world even though there are FTAs with almost every SAARC country except for Pakistan and Maldives.
Apart from that, India is also a signatory to regional trade agreements such as SAPTA and SAFTA covering all South Asian countries.
TABLE 5 (Values in $ Million)
Year 2021 -2022
Year 2022- 2023
India’s Imports from South Asia
5,486.37
5,446.03
India’s Total Imports
613,052.04
715,968.89
%Share
0.8949
0.7607
Values in $ Million
Year 2021 -2022
Year 2022- 2023
India’s Exports to South Asia
34,228.80
28,026.68
India’s Total Exports
422,004.40
451,070.00
%Share
8.1110
6.2134
(Source: Ministry of Commerce India – Export Import Data bank)
Why fewer exports from SA countries to India
The top 10 imports of India, such as crude oil, coal, petroleum coke, diamonds, precious metals, chemicals, pharma, rubber, plastics, electronics, and machinery, make up 82 percent of total merchandise imports into India.
Indeed, some of these products cannot be sourced from South Asian countries. Reasons are either lack of domestic production capability or inability to offer competitive pricing/value for money due to low productivity.
The other issue is the lower degree of trade complementary between India and other South Asian countries on most tradable products such as apparel, tea, rubber, coconut, spices, fruits, rice, onion, potato, and more.
These are common products for many South Asian countries and Indian domestic prices always enjoy a price advantage over imports.
In this context, South Asian countries need to enjoy tax concessions to enter into the price-sensitive Indian market.
The top 10 Indian exports, comprising petroleum products, jewellery, machinery, automobiles, chemicals, pharmaceuticals, cereals, iron steel, textiles, and electronics, have a high complementarity in imports from most of the South Asian countries.
These products offer competitive pricing to partner countries due to economies of scale and low-cost manufacturing processes.
Once again, it’s the comparative advantage of India that is finally responsible for the creation of trade with South Asian countries.
Overview of trade shifts in East Asia
FIGURE 1:
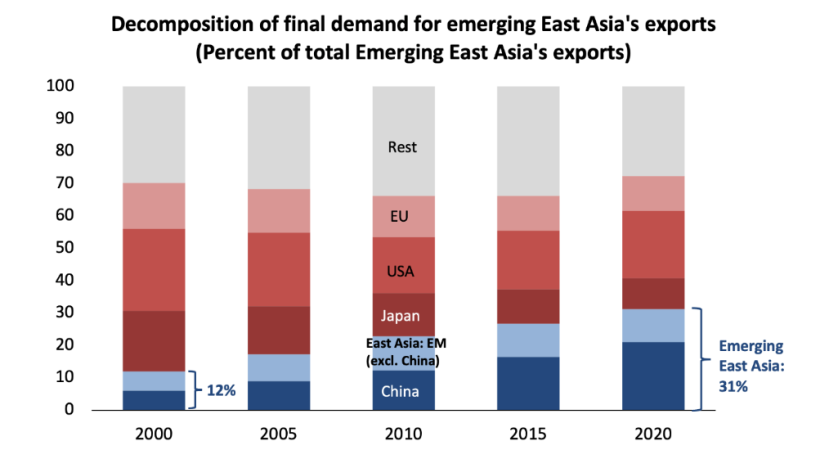
(Source: Inter-Country Input-Output tables)
Today, East Asia accounts for 17 percent of global trade in goods and services. With an average trade-to-GDP ratio of 105 percent, Only EU member states record above that (138 percent).
In 2021, intra-regional trade made up about 40 percent of the region’s total trade. At the end of 2021, China was the destination for nearly 20 percent of all goods exports from developing economies — roughly five times the share at the start of this century.
China has also become a much more important source of demand for commodities— particularly those that are central to the green-energy transition.
China is now not only the largest trading partner of most countries in the region but also the largest source of final demand for the region, recently surpassing the US and EU.
Export value-added absorbed by final demand in China climbed up from 1.6 percent of the region’s GDP in 2000 to 5.4 percent of GDP in 2021.
Rising Middle class in East Asia
FIGURE 2:
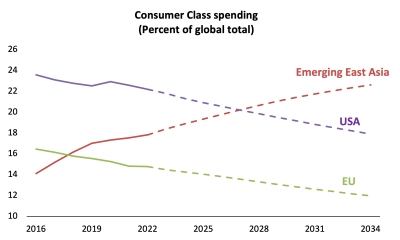
(Source: World Bank)
The middle-class population increased from 834.2 million people in 2016 to roughly 1.1 billion in 2022.
Today more than half of the population — 54.5 percent to be precise — has joined the ranks of the global consumer class, with daily consumer spending of $ 12 per day or more.
According to this definition, East Asia accounted for 29 percent of the global consumer-class population by 2022, and by 2030, one in three members of the world’s middle class is expected to be East Asian.
If we look at consumer-class spending, emerging East Asia is expected to become home to the largest consumer market sometime in this decade. According to the Global Attractiveness Index 2023, based on openness, innovation, efficiency, and endowment, ASEAN members are among the best-performing countries in Asia.
SL’s failure in creating trade
Historically, Sri Lanka has always struggled to create trade or gain significant benefits, especially for exporters, through FTAs. The analysis of past trade agreements (Tables 1, 2, 3, 4) signed by Sri Lanka clearly proves this point.
Sri Lanka’s approach to FTAs is engrossed in many irrational, illogical, and unexplainable factors.
Trade negotiation takes place secretly under the cover given by the Right to Information Act. Sri Lanka’s dream of creating trade or an export-oriented economy through trade liberalisation is still far from reality.
However, a point often made by pro-trade liberalisation camp is that exports from Sri Lanka are not growing fast because the country is lagging behind the fast-growing countries in Asia in signing FTAs.
This is only a misinterpretation of facts or a deliberate attempt to conceal real facts.
All high-performing countries in East Asia had become dynamic exporting nations well before the FTAs were signed. East and Southeast Asian countries such as Japan, South Korea, Taiwan, and Malaysia achieved explosive export growth in the 1980s in a hostile international environment with high tariffs and quantitative restrictions in partner countries.
Critical success factors behind the explosive trade growth of these East and South Asian countries are broader unilateral reforms with emphasis on export orientation adequately supported by political relationships, high productivity, comparative advantage, and the product range consists of high-valued products and yield– such as electronics, machinery and automobiles.
Naturally, these products help generate higher export volumes and high yields. Sri Lanka is recording poor export volumes all the time due to the export structure which is confined to low-valued items such as apparel, tea, rubber, spices, and more.
Can SL exploit trade opportunities in ASEAN/RCEP?
- Information gap: The knowledge about the trade policies, customs procedures, market regulations, distribution channels, compliances, and updated knowledge on product developments, new market trends, and innovations of RCEP countries are key to ensuring the success of Sri Lankan businesses. Sri Lanka has no dedicated market research arm in the Government or private sector to provide these advisory services to the business community.
- Price competition: The productivity of most of the major economies under RCEP such as China, Vietnam, South Korea, Malaysia, Japan, Philippines, Indonesia, and Thailand is very high. Further, these products do enjoy comparative advantage for apparel, tea, rubber, and spices. Therefore beating domestic prices of these countries will be a challenge for Sri Lankan exports.
- Lack of products required by RCEP countries: Major imports of RCEP countries are mechanical and electrical products, plastics, machinery parts, and chemicals. Sri Lanka does not have any of these products in its export basket.
- Challenge of creating a level playing field for SL’s tea, rubber, coconut: Most of the RCEP countries are also engaged either in manufacturing or exporting of these products, and therefore getting duty-free and unlimited access to these products will be an unlikely scenario. The past experience suggests that non-tariff measures too can be reasonably expected on the part of RCEP countries.
- Nature of market: Major East and Southeast Asian economies such as Japan, China, South Korea, Malaysia, Thailand, and Singapore under RCEP are brand-conscious markets, and the cost of branding for Sri Lankan companies to promote products such as tea and spices in RCEP countries will be very high.
- Agriculture: Agriculture is highly protected under RCEP and only 15 agricultural commodities representing 33 tariff lines will enjoy tax concessions.
Conclusion
From a global perspective, gains of trade agreements have been significantly lower due to the changes that took place in trade dynamics that existed previously.
Firstly much of the trade between FTA members as of now is in goods on which MFN tariff rates are zero or less.
Secondly, most countries allow duty-free imports for the supply of inputs used by free trade zones.
Thirdly, goods subject to high tariffs are often excluded from the list of concessions.
Fourthly, the electronic industry– one of the biggest contributors to world trade is virtually free of duty thanks to WTO’s Information Technology Agreement effective 2006.
Lastly, the intransigence and protective interests of the developed and powerful countries reign supreme over FTA negotiations.
Trade agreements are only set to deliver their objectives under the right and tight conditions. In Sri Lanka, it seems that policymakers consider trade liberalisation through trade agreements as a panacea for Sri Lanka’s export debacle.
India pulled out of RCEP after considering the impact on India’s domestic products and the likely impact on its deepening negative balance of payment with China as opposed to marginal gains from RCEP expected through trade.
In fact, no country should join any trade agreement without doing proper economic modelling or scenario planning.
Undoubtedly, Sri Lanka should get rid of its ‘FTA-mania’ and instead focus on solving primary issues that have a direct impact on the competitiveness of products.
Looking forward, joining RCEP for free trade or exports will be just another wishful thinking or guesswork only.
It is interesting to learn what President Washington the founder President of the USA said on trade agreements in his farewell address to the nation. He warned his fellow citizens that “there can be no greater error than to expect, or calculate upon, real favours from nation to nation.”
He also advised that trade agreements should be “temporary,” and “abandoned or varied, as experience and circumstances shall dictate.”
The Government of Sri Lanka’s intention to end the Department of Commerce mandate – the focal point for the World Trade Organisation (WTO) and hand over its functions to a non-trade body, under the proposed Economic Transformation Bill, raises the eyebrows of many.
Setting some key performance targets, and providing some sense of stability, predictability, and transparency for economic policymaking is always good but spreading out the roles and responsibilities of international trade among two institutions rather than streamlining and consolidation is highly questionable.
All countries, perhaps without exception, have a national focal point for trade and commerce, either a Ministry or Department.
However, the bill proposes to assign most of the functions related to trade to the Office of International Trade’. This office does not have any technical expertise (vis-à-vis Department of Commerce) and comes under the purview of the President.
It is true government institutions need to be revamped for efficiency, but medicine should not be more dangerous than the disease itself.
(The writer is the chairperson and executive secretary of the Asia Pacific Trade Agreement Chamber of Commerce and Industry)
-------------------
(The views and opinions expressed in this column are those of the author, and do not necessarily reflect those of this publication.)